Tutorial
A guide to exploring endogenous retroviruses in the human genome with ERV Navigator.
1. Welcome: what is ERV Navigator?
The human genome contains thousands of sequences derived from ancient retroviruses that infected the germlines of our vertebrate ancestors. These endogenous retroviruses (ERVs) range from relatively intact proviruses to highly degraded genomic fragments.
ERV Navigator brings these elements together within a single evolutionary framework. It links:
- genomic loci (specific, mapped locations in the human genome),
- to reconstructed viral lineages (the ancestral viruses those loci derive from), and
- to a phylogenetically grounded retrovirus taxonomy (a hierarchical classification of those lineages).
In other words, ERV Navigator lets you move fluidly between "where is this element in the genome?" and "what is this element, evolutionarily?"
ERV Navigator was created by collaborating researchers at the Blanco-Melo Lab at Fred Hutch Cancer Center and the Gifford Group at the Centre for Epidemic Response and Innovation (CERI), Stellenbosch University, with support from the Fred Hutch Office of the Chief Data Officer (WILDS Collaborations program). Full attribution and funding information is on the About page.
What you can do here
- Browse the ERV taxonomy from broad clades down to individual genomic loci.
- Inspect reference sequences, metadata, genes/features, and expression data for any lineage or locus.
- Visualize the full evolutionary tree of ERVs and a heatmap of ERV expression across tissue/cancer types.
- Search by lineage name, locus identifier, external alias, overlapping gene, or genomic coordinates.
- Download sequences and metadata in standard bioinformatics formats (TSV, BED, GTF, FASTA).
A note on data provenance
ERV Navigator implements a database curated by the Blanco-Melo Lab and the Gifford Group. Genomic coordinates use the hg19 (GRCh37) reference assembly unless otherwise noted (this is stated on the Data Dictionary page). Expression values are derived from preprocessed RNA-seq coverage data from recount3 and summarized across TCGA cancer types. Because HERVs are highly repetitive, expression estimates should be interpreted as approximate indicators of transcriptional activity, not as absolute, locus-specific measurements. This disclaimer is repeated on every page that shows expression data.
2. Finding your way around
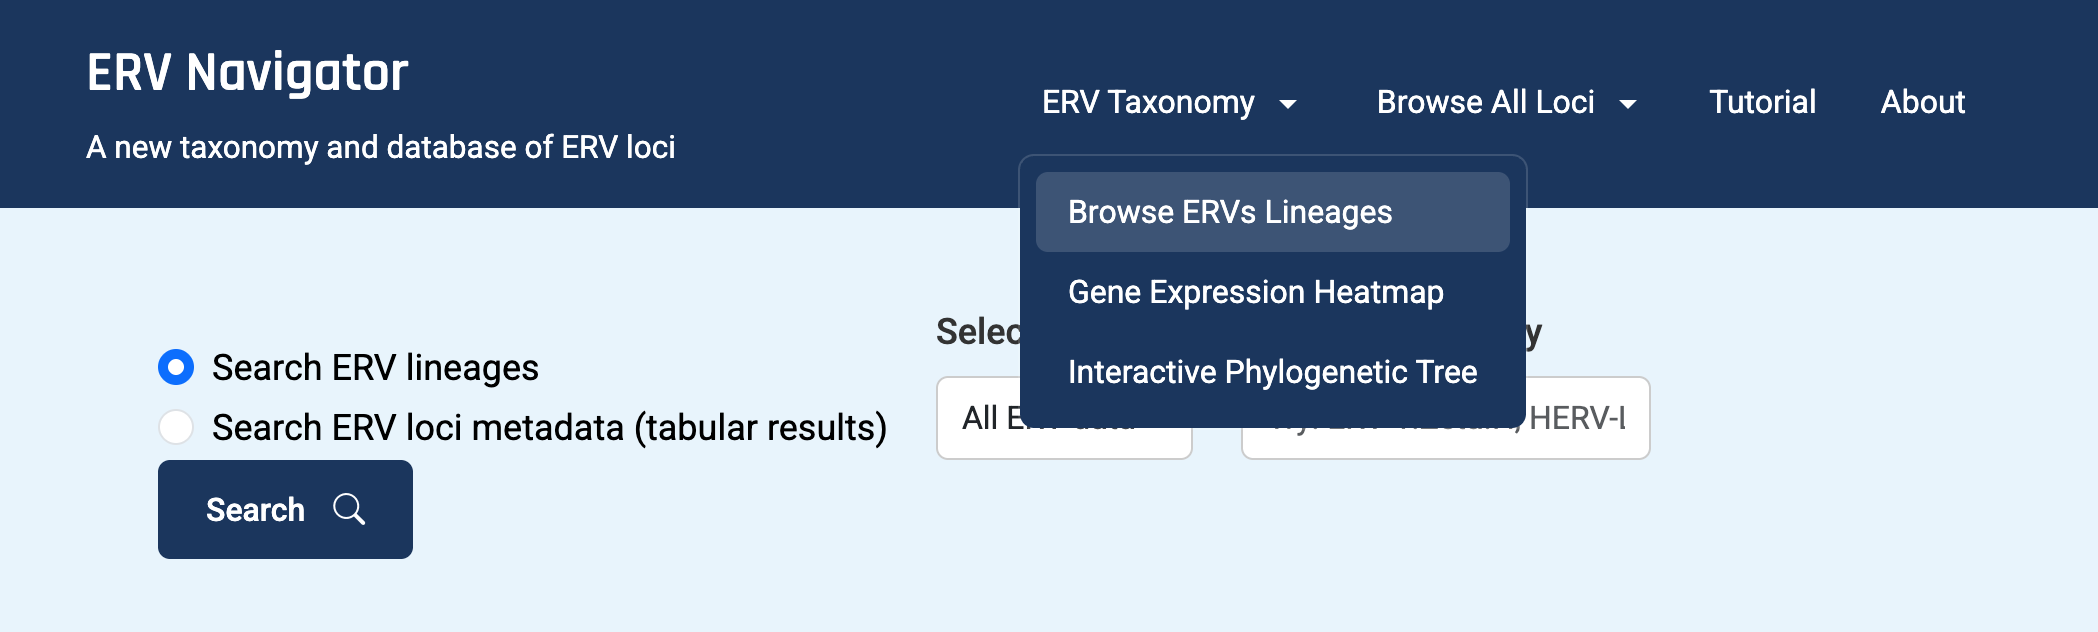
The bar at the top of every page is your home base. On the left, the ERV Navigator wordmark always returns you to the front page. On the right are the main menus:
-
ERV Taxonomy (dropdown)
- Browse ERVs Lineages — the front page taxonomy browser.
- Gene Expression Heatmap — the expression visualization.
- Interactive Phylogenetic Tree — the full tree viewer.
-
Browse All Loci (dropdown)
- Browse Loci Table — every locus in one filterable, downloadable table.
- Data Dictionary — definitions for every column in the loci tables.
- Tutorial — this guide.
- About — authors, collaborators, and funding.
On smaller screens these collapse into a hamburger (☰) menu button.
3. Browsing the taxonomy on the front page
The front page has three parts, top to bottom.
3.1 The search bar
A search form sits at the very top of the page and is always available here and again on the search results page. How to use it in detail is covered in the search section
3.2 The introduction and "Explore Data Visualizations" card
Below the search bar, a short introduction explains the purpose of the resource. To its right, the Explore Data Visualizations card gives one-click access to:
- Explore interactive tree → — the full phylogenetic tree of ERV lineages.
- Explore gene expression heatmap → — ERV expression across cancer types.
Both are described in the data visualizations section.
3.3 The ERV Taxonomy browser
The heart of the front page is the section titled The ERV Taxonomy. This is where you browse the classification hierarchy.
How the hierarchy is organized
ERV Navigator organizes lineages into a nested structure:
Clade → Phylogeny Group (genus) → Subgroup (subgenus) → ERV lineage → loci
The taxonomy is split into four blocks shown one after another down the page:
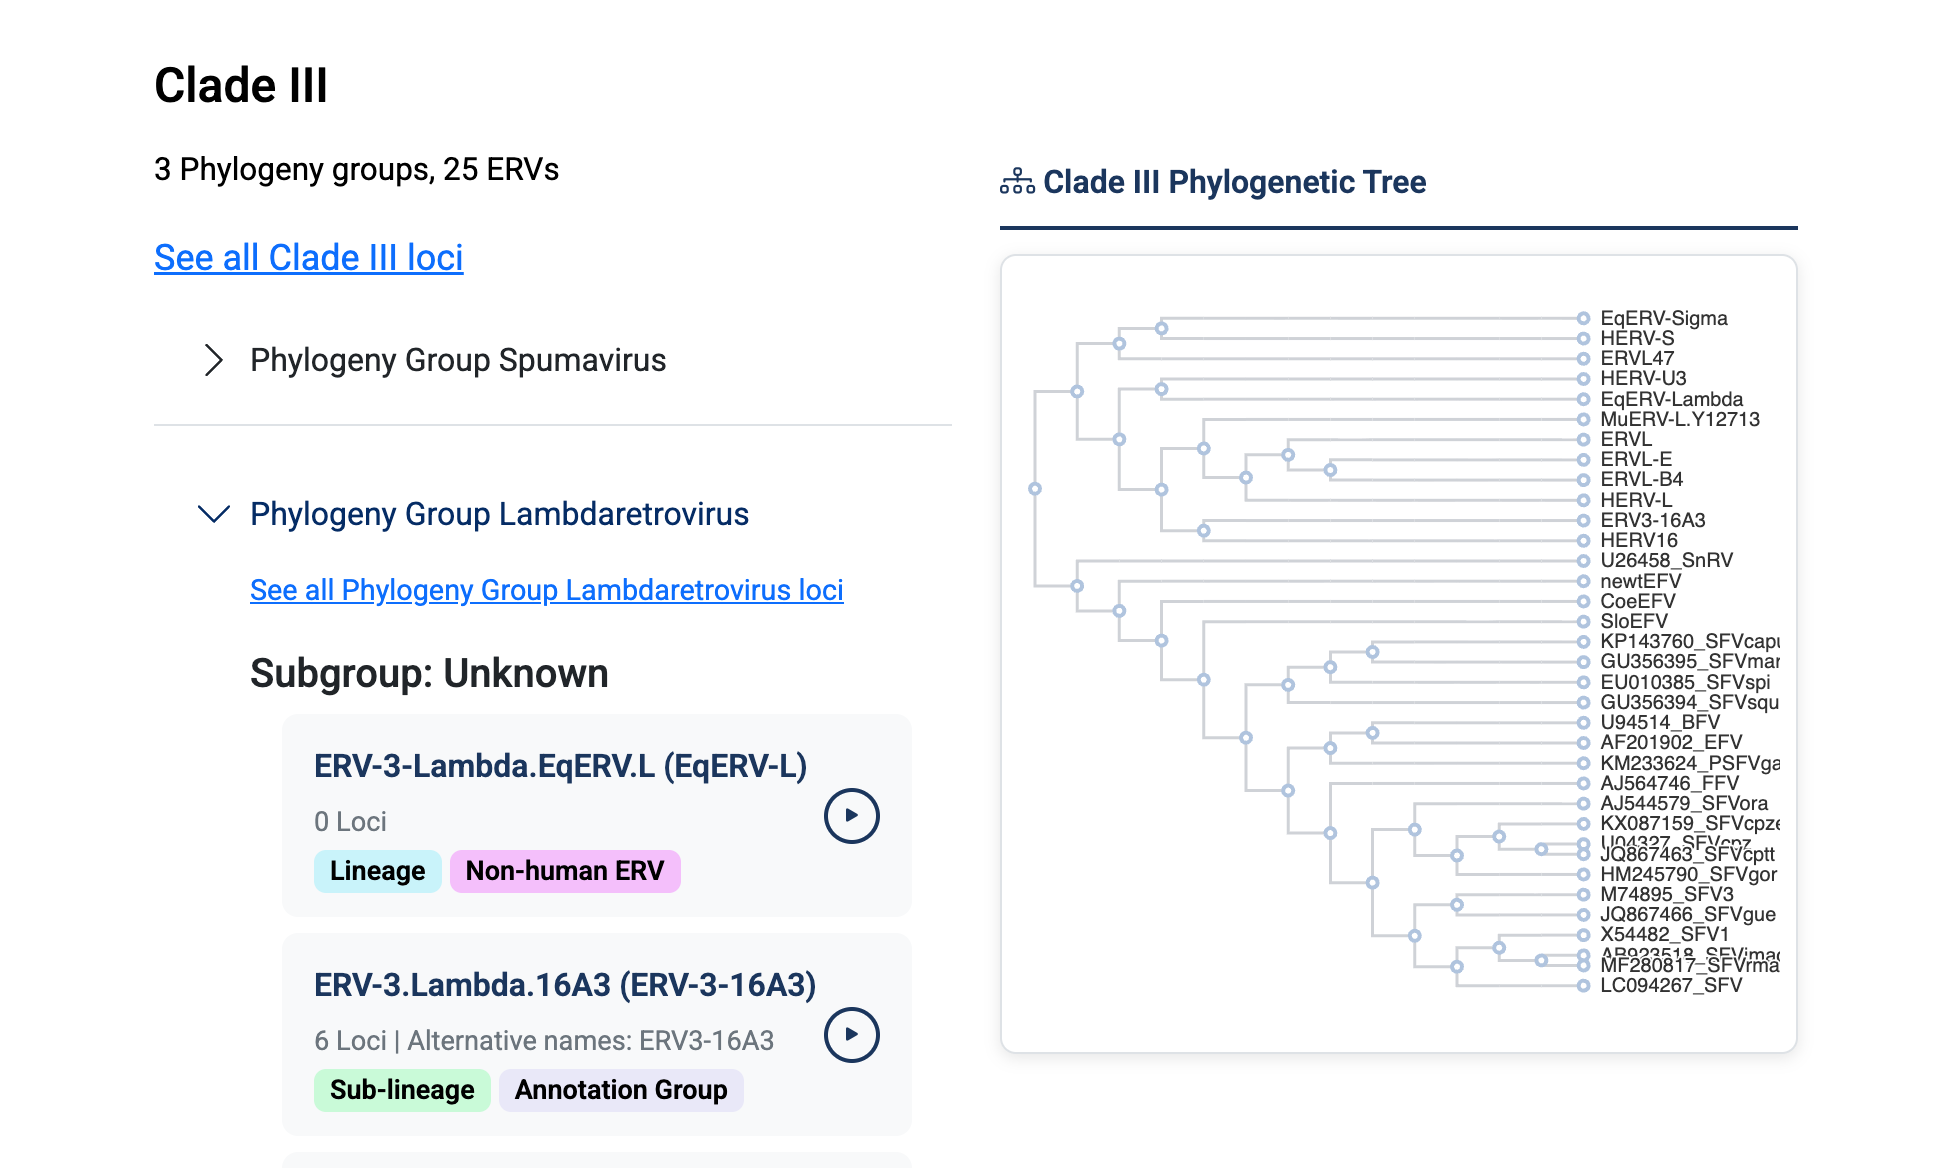
- Clade I, Clade II, and Clade III — the three major phylogenetic clades. Each block shows a summary line counting the number of phylogeny groups and ERVs it contains.
- Mosaic Loci — a special block for loci that cannot be assigned cleanly to a single clade (their categories are listed instead of phylogeny groups).
Working within a clade block
Each clade block has two halves on a desktop screen:
-
Left half — the interactive list.
- A "See all Clade X loci" link opens the complete loci table for that entire clade (see the loci table section).
- Below it, each Phylogeny Group is a collapsible accordion. Click a group heading to expand it.
- Inside an expanded group you'll find a "See all Phylogeny Group X loci" link (opens that group's loci table) and one or more Subgroups.
- Each subgroup lists its ERV lineage cards. Every card shows the lineage name, its internal identifier, the number of loci it contains, any alternative names, and classification badges. Click a card to open that lineage's page (see the lineage pages section).
- Right half — the clade's mini phylogenetic tree. A compact, scrollable tree for that clade is "pinned" so it stays visible while you scroll through the list on the left. It gives quick visual context for how the groups in that clade relate to one another.
4. Data visualizations
These two pages give big-picture, exploratory views of the dataset. Both are best viewed on a desktop or laptop; on small screens they will warn you that the experience is limited.
4.1 Interactive Phylogenetic Tree
Reachable from the front-page card or ERV Taxonomy → Interactive Phylogenetic Tree. This is a full, interactive rendering of the ERV phylogeny. A toolbar above the tree lets you:
- Adjust spacing — expand or compress the tree vertically or horizontally.
- Sort branches ascending, descending, or back to the original order.
- Switch layout between Linear and Radial.
- Align tip labels to the left or right.
- Export SVG — save the current view as a vector image for figures.
- Filter branches — type in the filter box to find branches by name.
- Select branches — a counter shows how many branches you've selected.
4.2 Gene Expression Heatmap
Reachable from the front-page card or ERV Taxonomy → Gene Expression Heatmap. The heatmap shows:
- Rows: HERV groups.
- Columns: TCGA cancer types (and sample types).
- Color: the Z-score of log10 TPM expression, shown by the legend on the right.
Hover over any cell and click to see a tooltip reporting the HERV group, cancer type, sample type, and exact Z-score. On tablet widths the heatmap scrolls horizontally so you can reach every column and the y-axis labels.
5. ERV lineage pages
An ERV lineage page is the reference record for a single
reconstructed viral lineage. You reach it by clicking a lineage card in the
taxonomy, a lineage link in any loci table, or a lineage result in search.
The URL pattern is /lineage/{id}.
5.1 Page header
At the top you'll see:
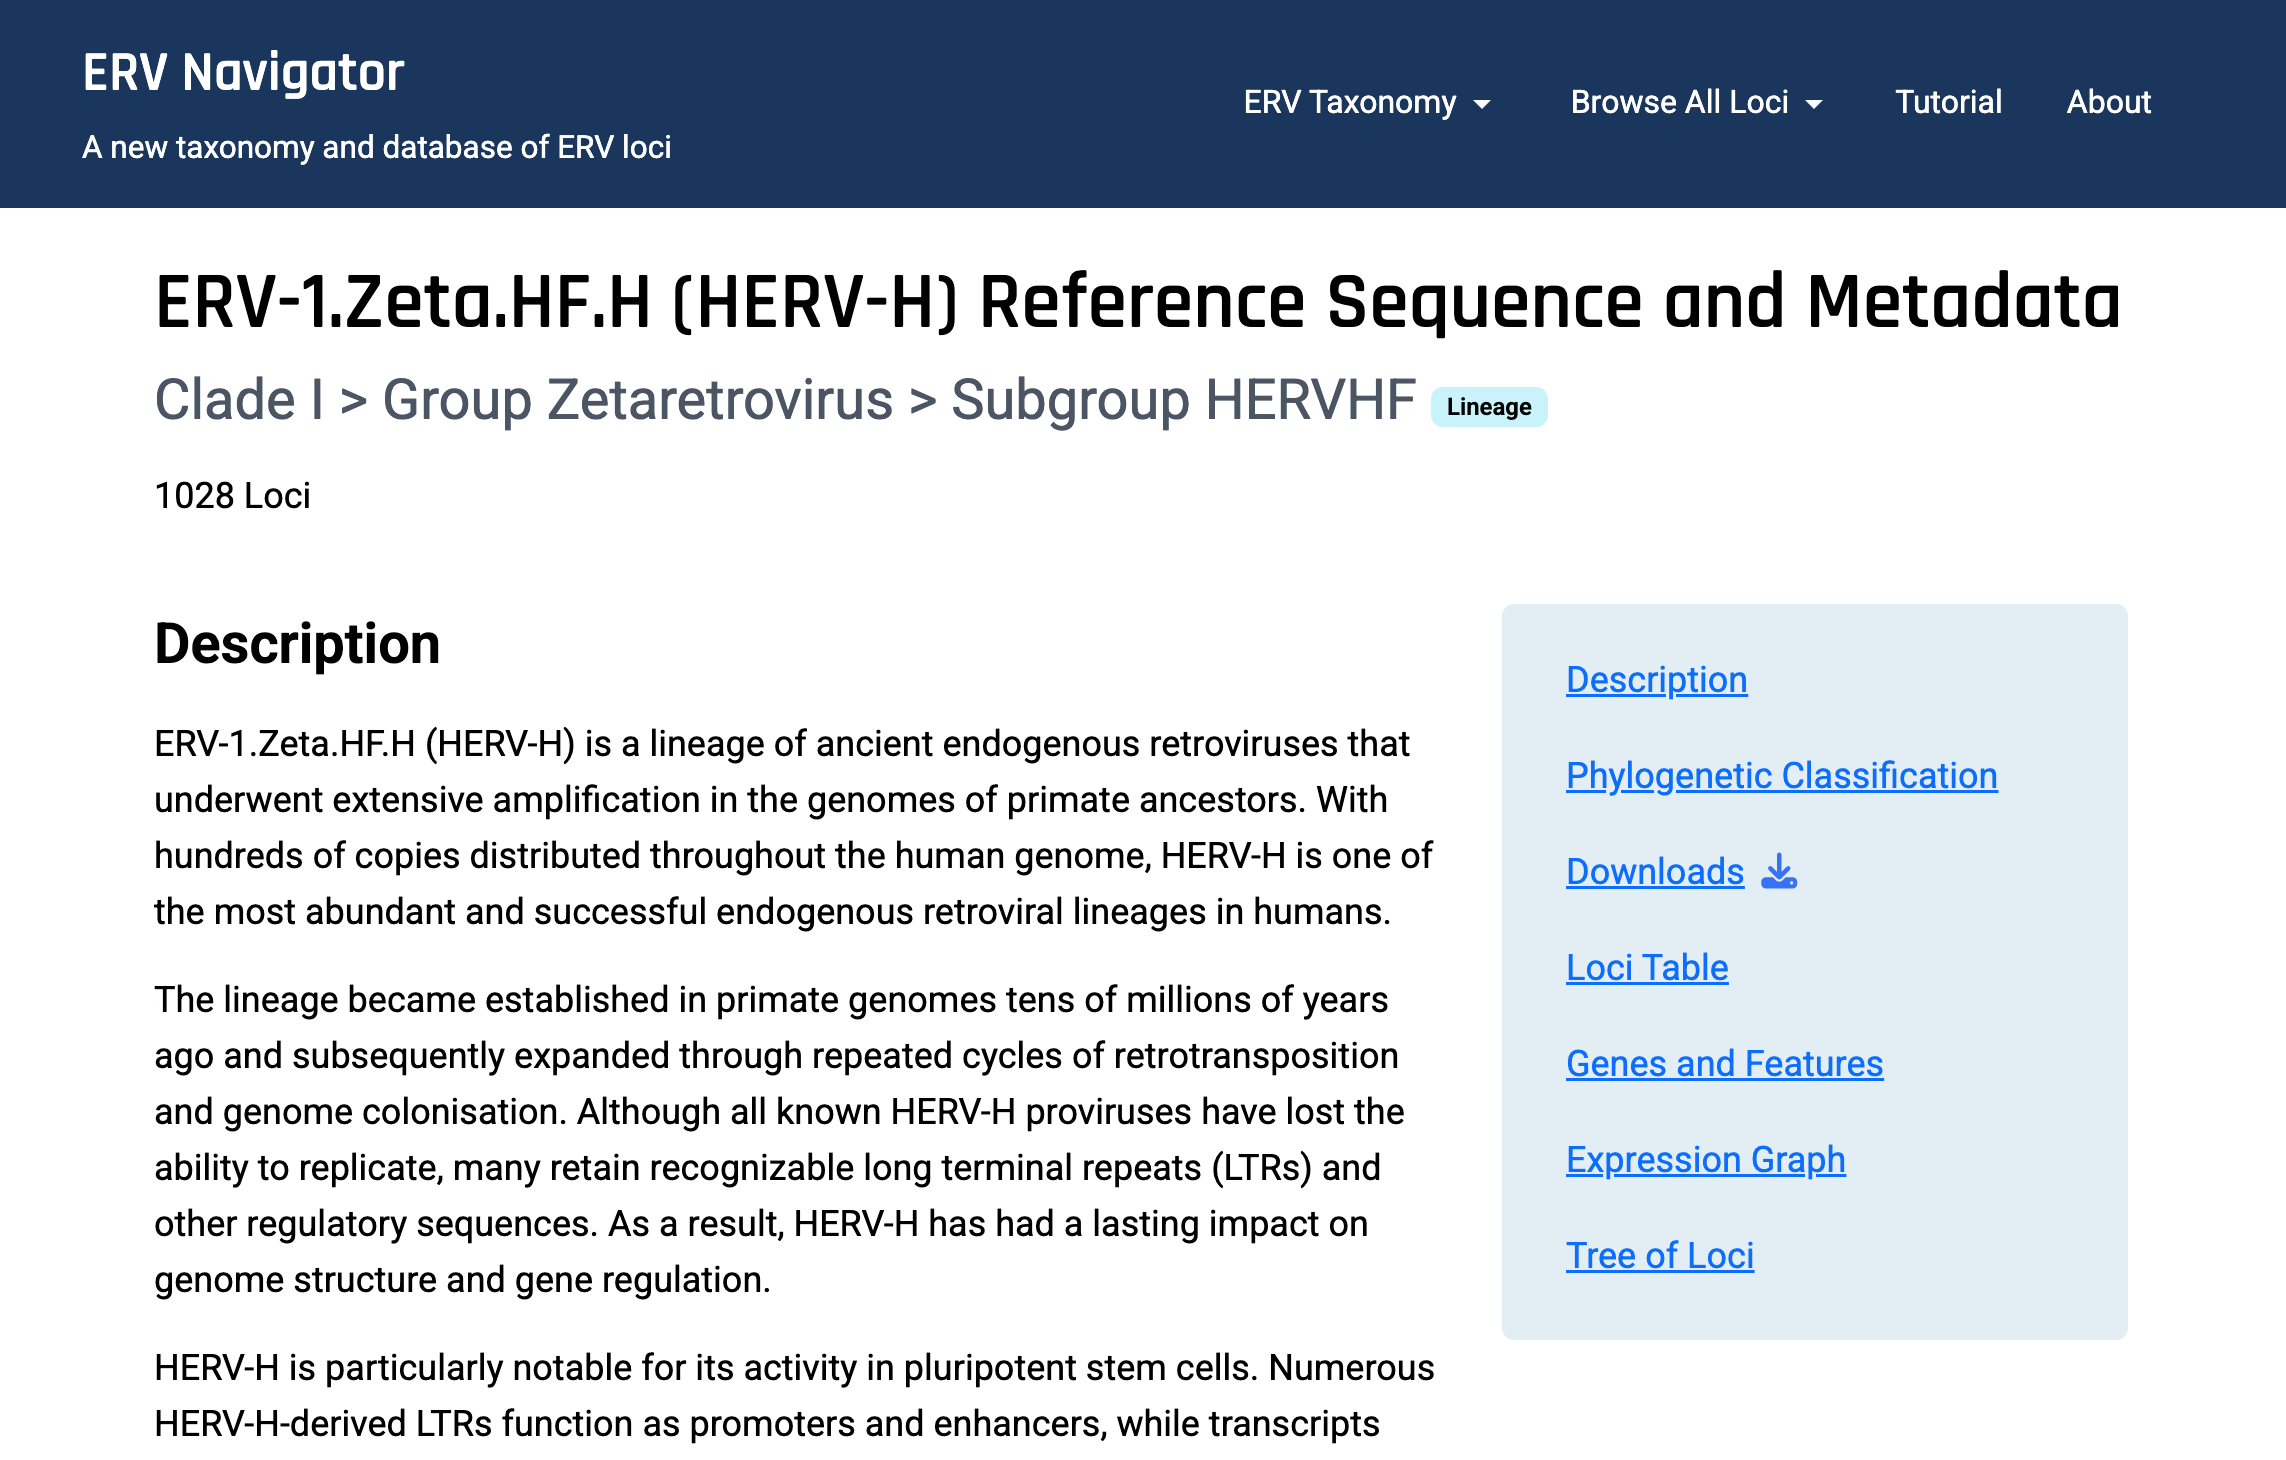
- A title combining the lineage name and (where different) its internal identifier, e.g. "ERV-1.Zeta.HF.H (…) Reference Sequence and Metadata".
-
A classification subtitle reading
Clade … > Group … > Subgroup …, with classification badges. - A locus count — how many genomic loci belong to this lineage.
5.2 Table of contents (sidebar)
A sticky sidebar lists the sections of the page and follows you as you scroll. Depending on what data exists for the lineage, it links to: Description, Phylogenetic Classification, Downloads, Loci Table, Genes and Features, Expression Graph, and Tree of Loci.
5.3 The main sections
- Description — a curated, narrative description of the lineage (when available).
- Phylogenetic Classification — the full classification path (Clade > Genus > Subgenus), the lineage age (or "Not Available"), the number of loci, and Alternative Names drawn from external ERV resources.
-
Downloads — direct links to the lineage's
reference locus sequence (
.fas/.fna) and a multiple-sequence alignment (.fna), when those files exist. - Loci Table — every locus assigned to this lineage, in the interactive table described in the loci table section.
- Genes and Features — a second interactive table of genes/features annotated on this lineage, with its own column chooser and download button. Below it, two collapsible accordions provide Feature Sequences (nucleotide) and Translated Sequences (amino acid). Each sequence has a Copy button that copies it to your clipboard.
- Expression Graph — a box-plot of expression across cancer/tissue types (with the standard exploratory-use disclaimer).
- Tree of Loci — a collapsible phylogenetic tree of the loci within this lineage. Click "Expand the tree" to render it.
6. How to use the loci table
The interactive loci table is the workhorse of ERV Navigator. The same table structure appears in several places:
- On an ERV lineage page (the loci belonging to that lineage).
- On the Browse All Loci page and the "See all … loci" links from the taxonomy (loci filtered by clade, group, or "mosaic").
- On the search results page when you search in loci mode.
Because the controls are identical everywhere, learning them once is enough.
6.1 The columns
Each row is one genomic locus. Available columns include:
| Column | What it shows |
|---|---|
| Missillac ID | The unique locus identifier. Click it to open the locus page. |
| Lineage ID | The lineage the locus belongs to. Click it to open the lineage page. |
| Alternative Names | Aliases from external resources (DIGS, RepBase, RetroTector). |
| Chromosome / Strand / Start / End | Genomic position (hg19). |
| Sequence Length | Length of the locus in base pairs. |
| Major Clade / Genus / Subgenus | Taxonomic classification. |
| Coverage | A visual coverage bar — click a coverage cell to open a detail popup. |
| Features | Annotated genes/features overlapping the locus. |
| Supporting Datasets | Datasets supporting the locus. |
| Category | The locus category. |
| Taxonomic Resolution | How precisely the locus could be classified. |
| UCSC Link | A View link that opens the locus in the UCSC Genome Browser (new tab). |
| Host Species / Genome Build | Source organism and assembly. |
Full definitions, allowed values, and examples for every column are on the Data Dictionary page (linked directly above every table).
6.2 Sorting
Click any column header to sort by that column; click again to reverse the order. Chromosome sorting is natural (chr1, chr2, … chr10), not alphabetical.
6.3 Filtering
Each column has a filter control directly under its header:
- Text filters (e.g. Missillac ID, Lineage ID, Features): type to match.
- Dropdown/list filters (e.g. Chromosome, Strand, Clade, Genus, Subgenus, Category, Host Species, Genome Build): pick from the available values.
-
Numeric filters:
- Start filters to "at least" the value you enter (≥).
- End filters to "less than" the value you enter (≤).
- Sequence Length filters to "at least" the value you enter (≥).
Filters combine, so you can narrow to one chromosome and a minimum length at the same time.
6.4 Choosing which columns to show
Click the Columns button (with the chevron) to open the column chooser, then tick or untick columns to show or hide them. This lets you build a focused view or reveal fields hidden by default.
6.5 Pagination
By default the table shows 20 rows per page. Use the page-size selector in the footer to switch among 10, 25, 50, 100, or 200 rows per page, and the pager to move between pages.
6.6 Expanding to full width
Click Expand to grow the table to the full width of the window for easier reading of many columns. Click Collapse (or press Esc) to return to the normal layout.
6.7 Downloading data
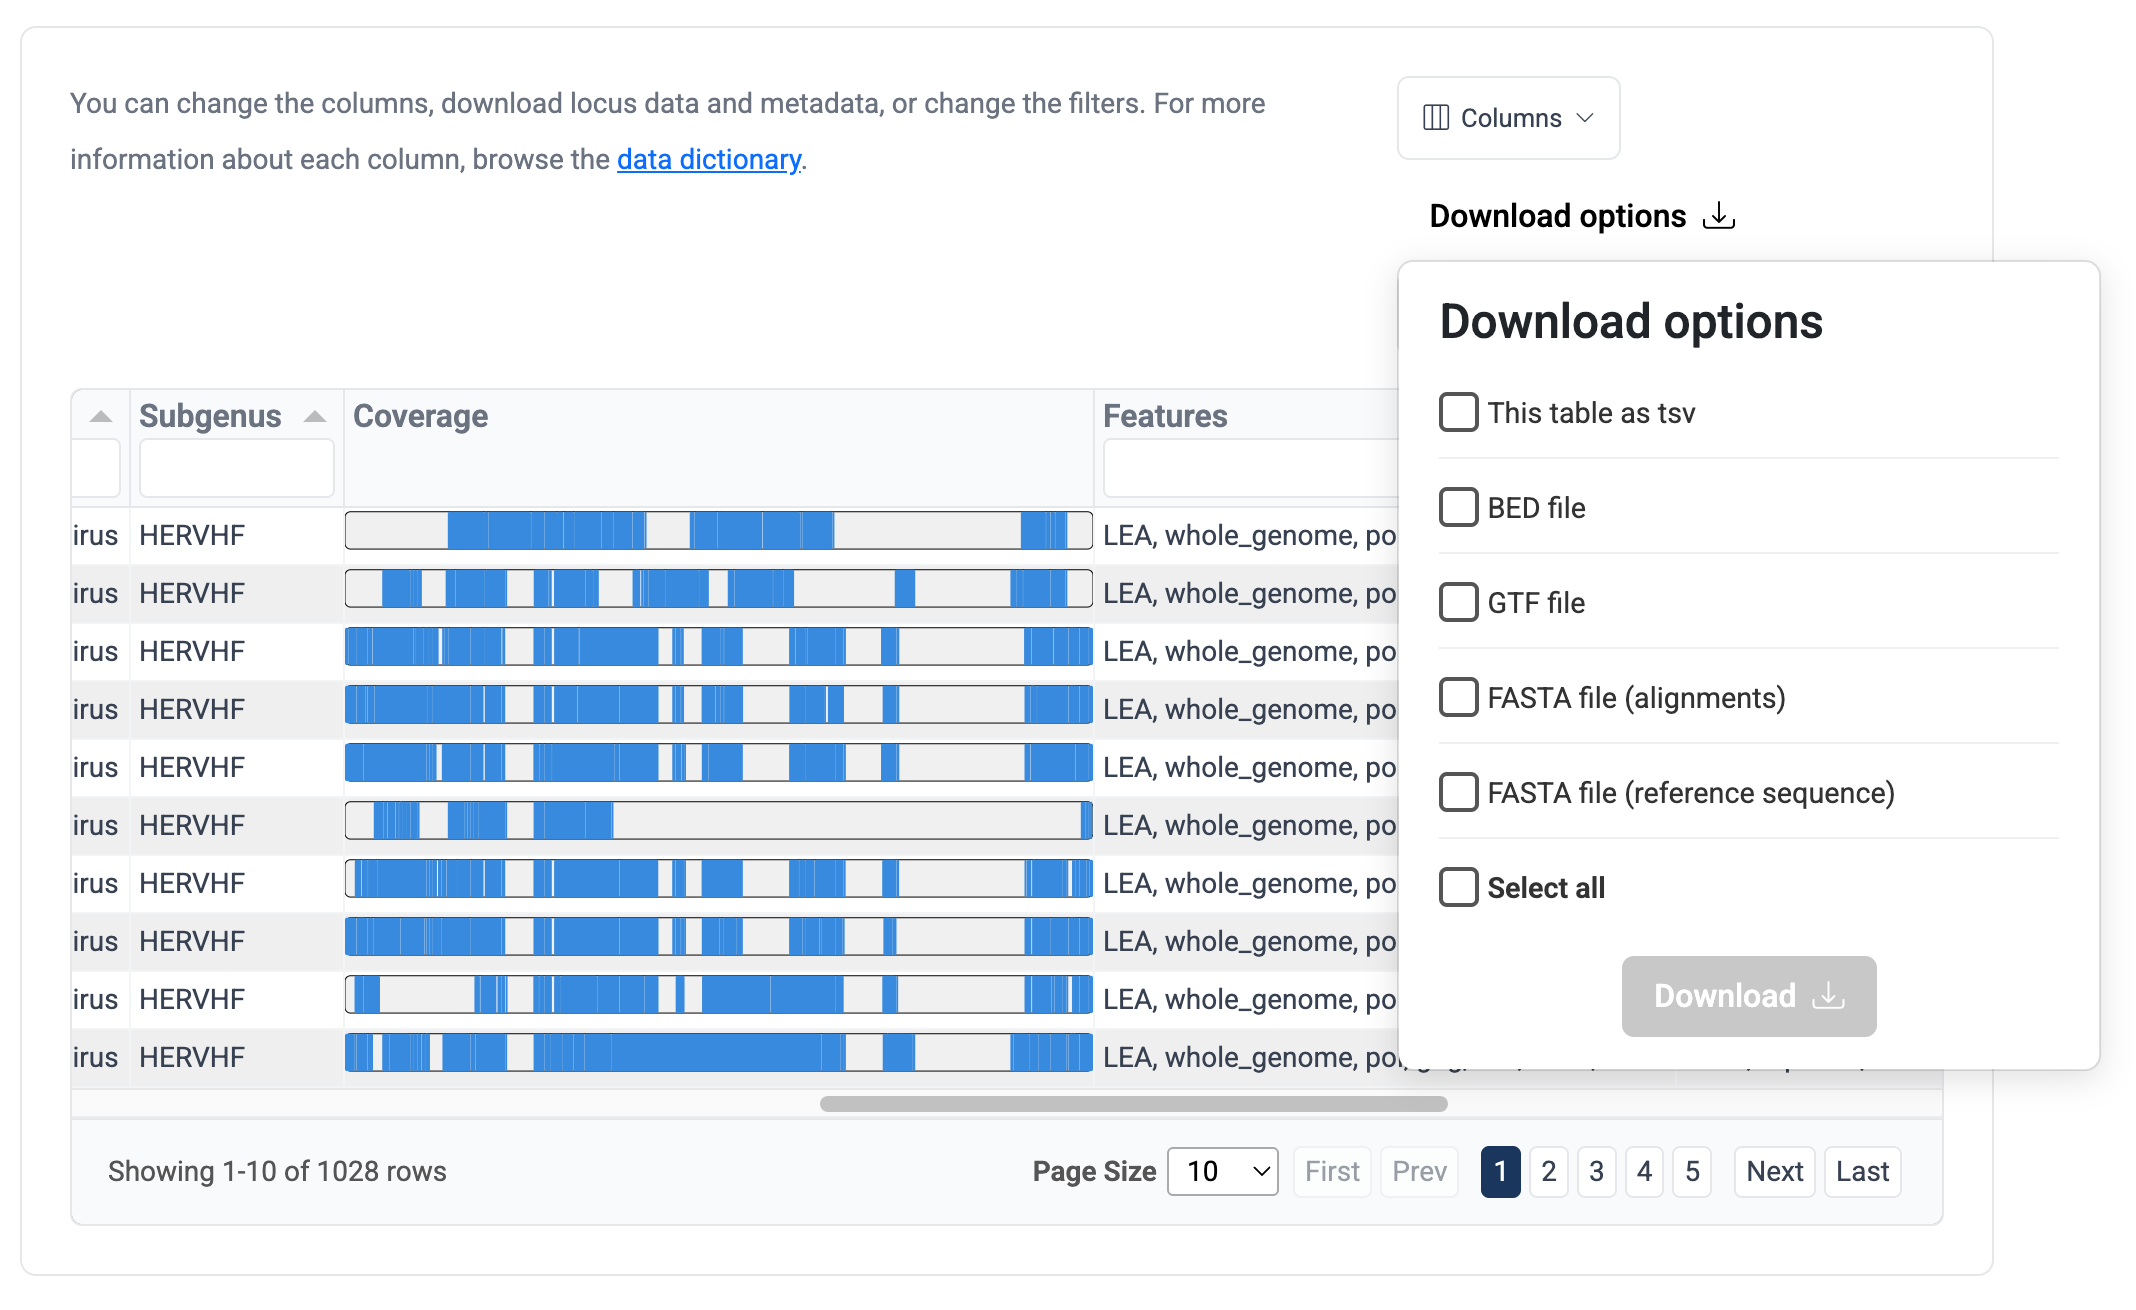
Click Download options to open a menu of formats. Tick any combination of:
- This table as TSV — the table contents as tab-separated values.
- BED file — genomic intervals in BED format.
- GTF file — features in GTF format.
- FASTA file (alignments) — aligned sequences.
- FASTA file (reference sequence) — reference sequences.
Use Select all to tick everything at once, then click Download. The download reflects the rows currently in the table (including any filters you've applied), so you can filter first and export exactly the subset you need.
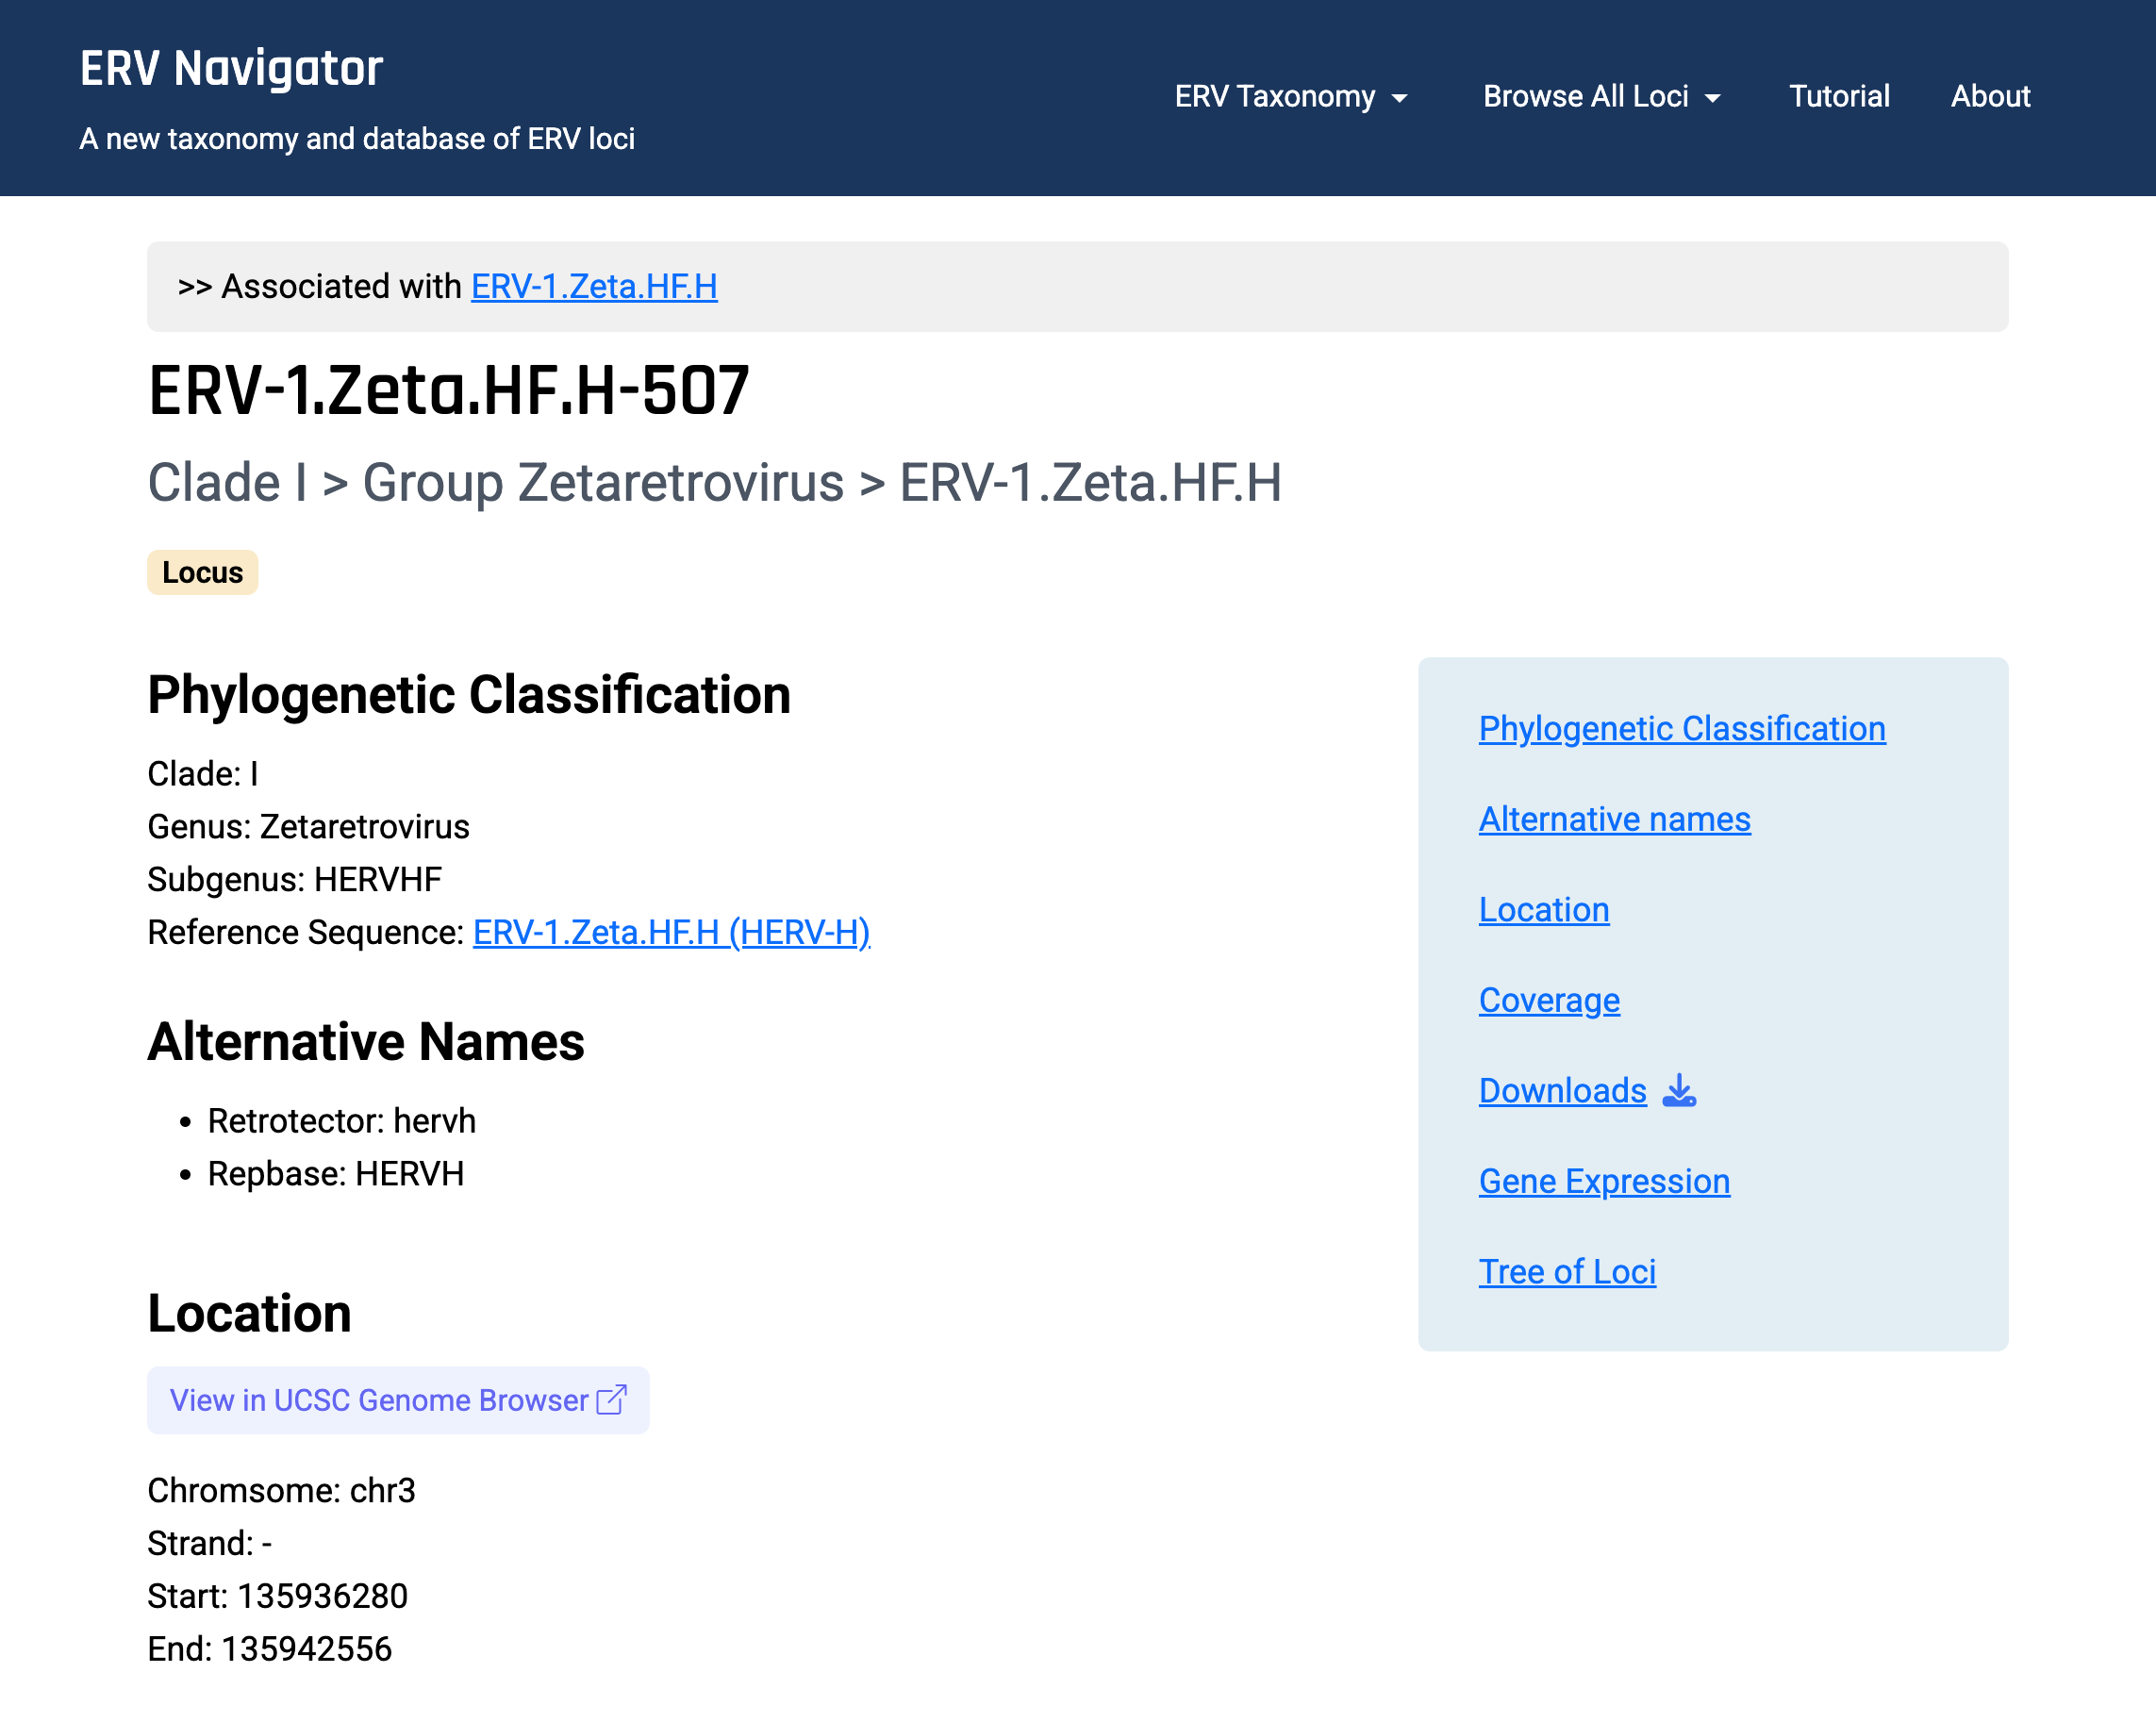
7. ERV locus pages
A locus page is the detailed record for one specific genomic
location. You reach it by clicking a Missillac ID in any loci
table or a locus result in search. The URL pattern is /locus/{id}.
7.1 Page header
- A banner reads ">> Associated with [lineage]", linking back up to the parent lineage page.
- The title is the locus's Missillac ID.
- A classification subtitle shows the full path down to the lineage.
- A "Locus" badge identifies the page type.
7.2 Table of contents (sidebar)
A sticky sidebar links to: Phylogenetic Classification, Alternative names, Location, Coverage, Downloads, Gene Expression, and Tree of Loci.
7.3 The main sections
- Phylogenetic Classification — the locus's Clade, Genus, and Subgenus, plus a link to its reference sequence (the parent lineage page).
- Alternative Names — aliases from external resources (if any).
- Location — the genomic coordinates (Chromosome, Strand, Start, End) and a prominent "View in UCSC Genome Browser" button that opens the locus in UCSC in a new tab. This is the bridge from ERV Navigator to the broader genome browser ecosystem.
- Coverage — a coverage diagram for the locus (or a note if none is available).
-
Downloads — a link to the locus alignment file
(
.fna), when available. - Gene Expression — a box-plot of expression for this locus (with the exploratory-use disclaimer).
- Tree of Loci — a phylogenetic tree in which this locus is highlighted in green so you can see its placement among related loci. Click "Expand the tree" to render it. If the locus isn't represented in a tree, the page links you to the parent lineage page to explore the tree of associated loci there.
8. How to use the search
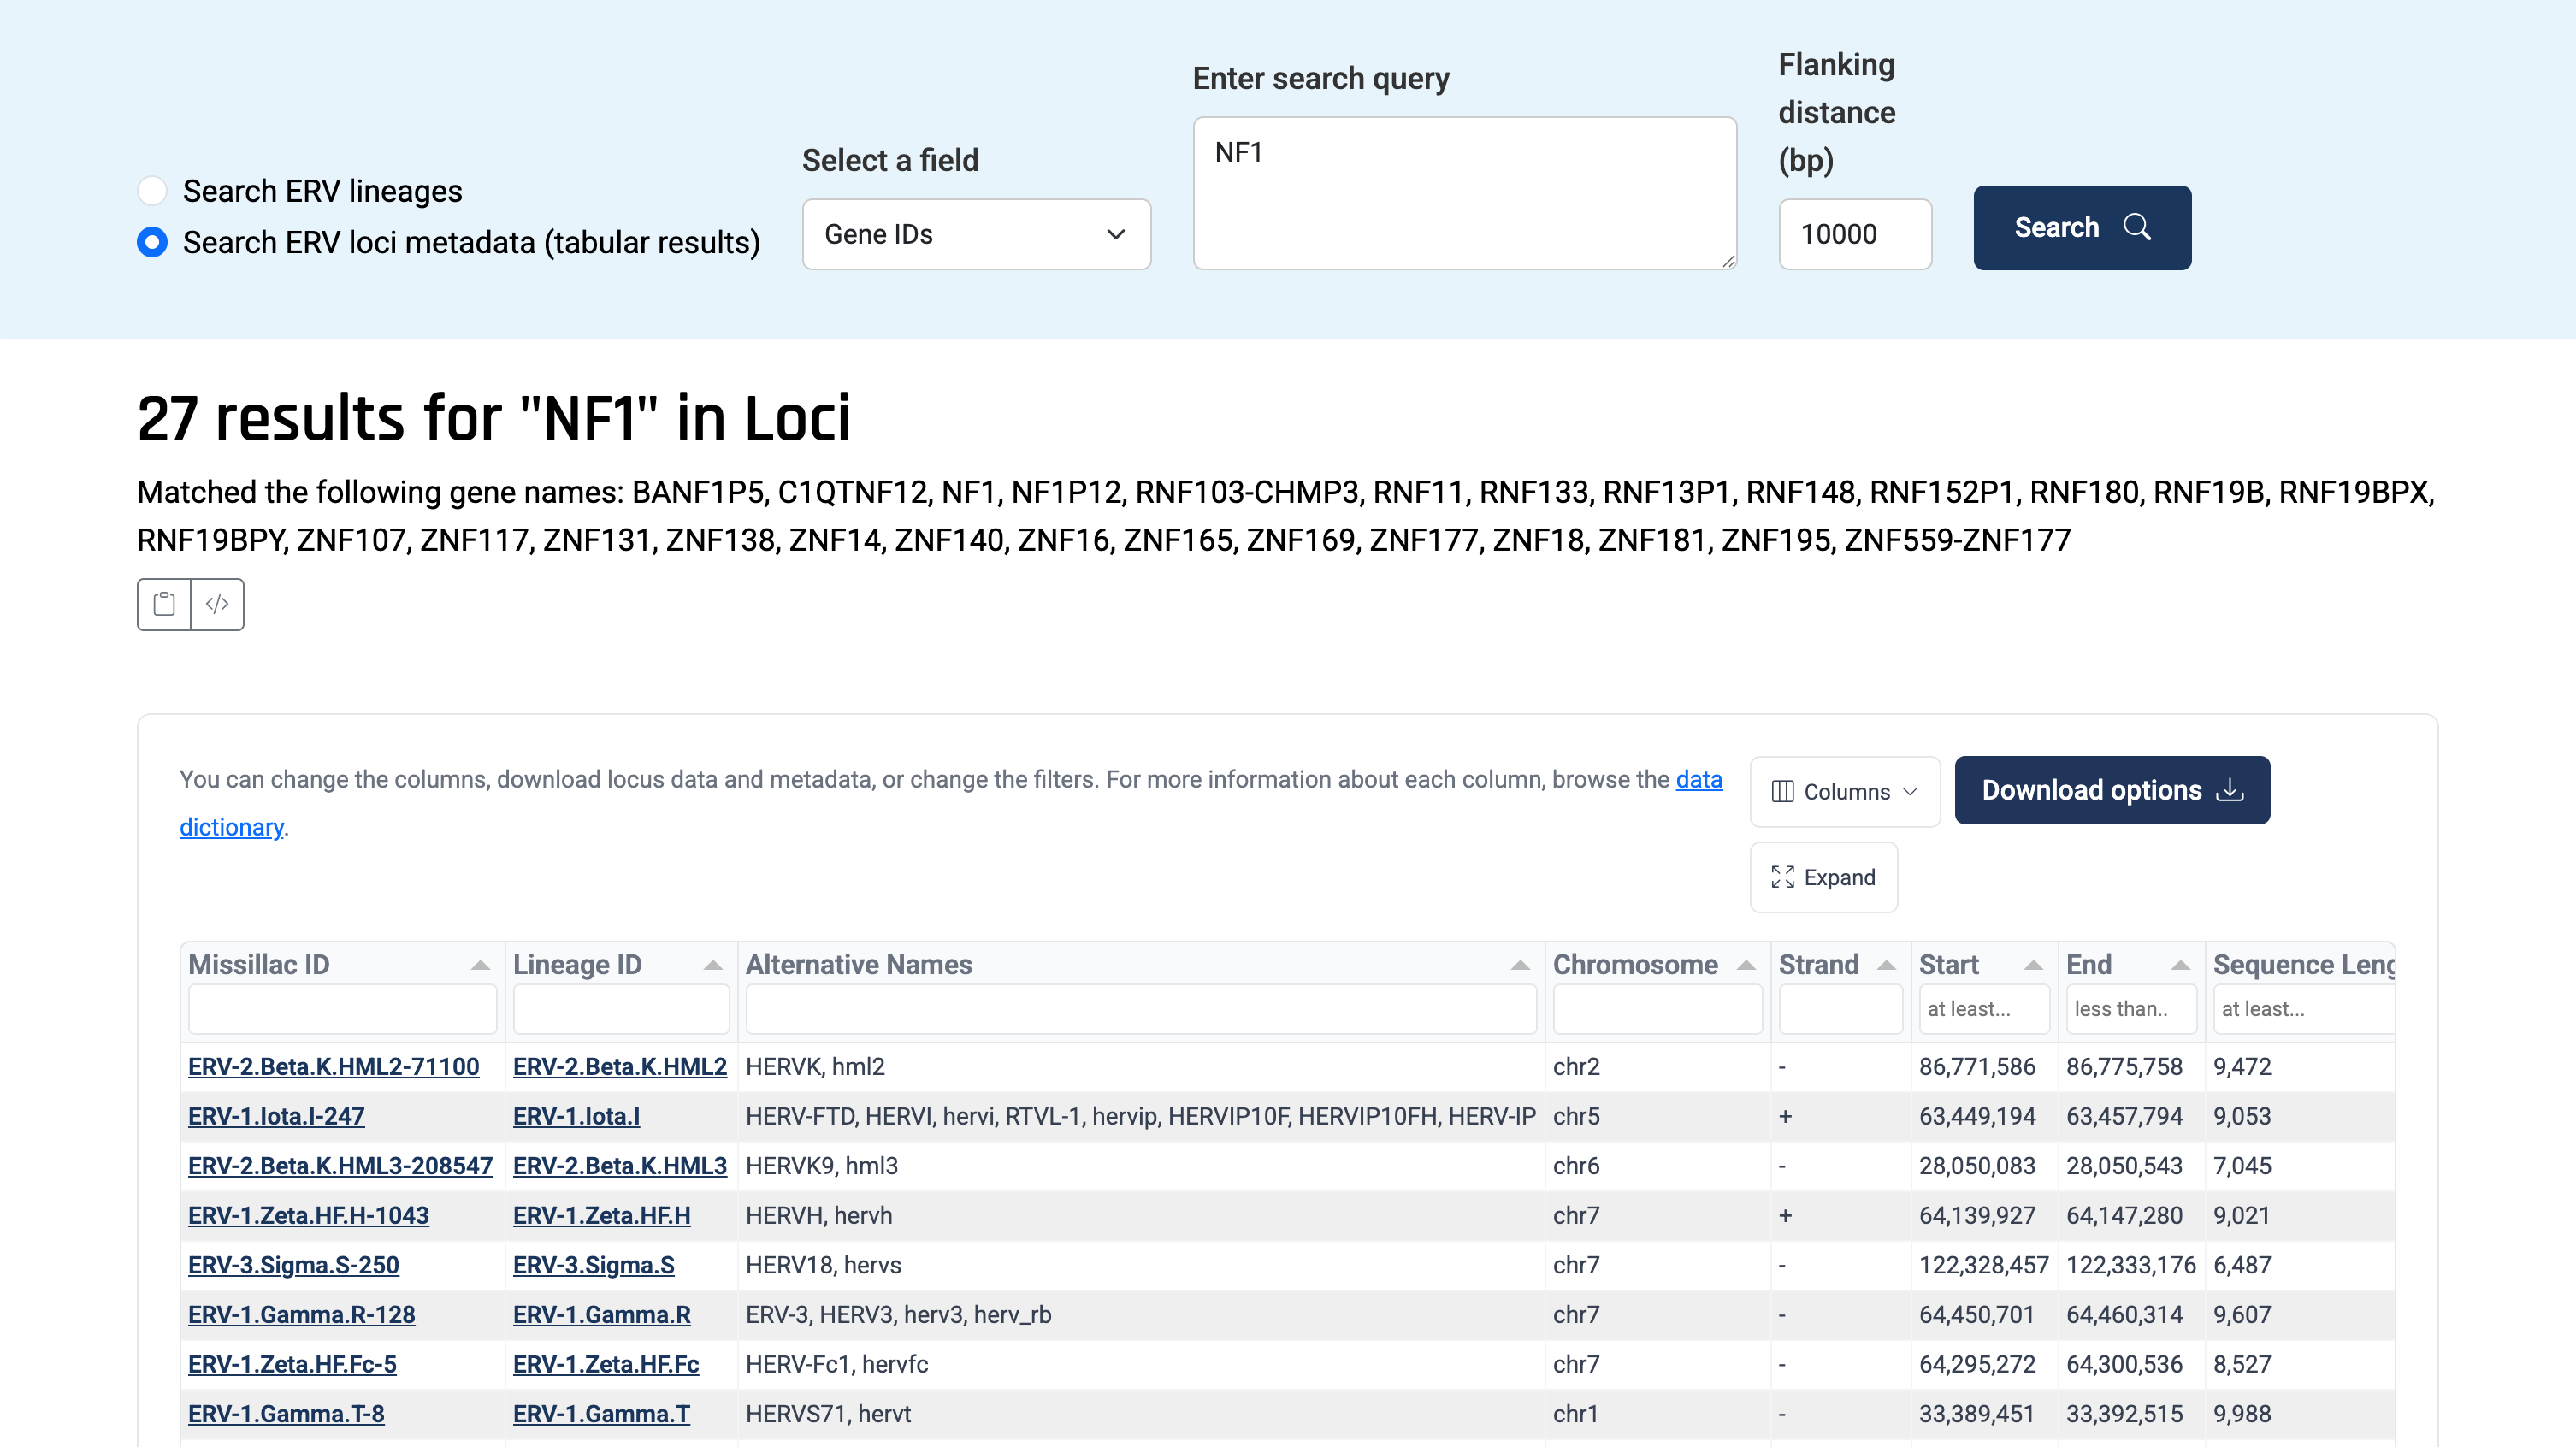
The search form appears at the top of the front page and again on the search results page, so you can refine a search without going back. It has four parts, read left to right: what to search, which field, your query, and (sometimes) flanking distance.
Choose what to search (search mode)
Two radio buttons:
- Search ERV lineages — returns matching lineages, shown as cards.
- Search ERV loci metadata (tabular results) — returns matching loci, shown in the interactive loci table.
Your choice changes which fields are available in Step 2.
Choose which field (search type)
When searching ERV lineages:
- All ERV data — broad search across lineage data.
- ERV identifiers (including outside lit.) — lineage IDs and external names.
- Gene IDs — find lineages whose loci overlap given genes.
When searching ERV loci metadata:
- All locus metadata — broad search across locus fields.
- Locus identifiers — Missillac IDs and related identifiers.
- ERV identifiers (including outside lit.) — by lineage name/alias.
- Gene IDs — loci overlapping given genes.
- Locations — by genomic coordinates (loci mode only).
The placeholder text in the query box updates to show valid examples for the field you pick.
Enter your query
The query box adapts to the field:
-
For most fields it's a single-line text box. Example
placeholders include
ERV-1.Zeta.H,HERV-L,ERV-Lb4(lineages) orERV-1.Zeta.HF.H-507,ERV-2.Beta.K(loci). - For Gene IDs and Locations it becomes a multi-line text area so you can enter several entries at once.
Searching by gene — matching rules
When the field is Gene IDs:
- Separate multiple terms with commas, spaces, or new lines.
- Wrap a term in double quotes for an exact (case-insensitive) match — e.g.
"NF1"matches only the gene named exactly NF1. - Leave a term unquoted for a fuzzy/substring match — e.g.
RUNXmatches RUNX1, RUNX2, etc. - Terms are combined with OR: a result matches if it satisfies any one term.
After a successful gene search, ERV Navigator shows which gene names matched, with buttons to copy that list as plain or quoted comma-separated values — handy for refining or documenting a query. If nothing matches, the page explains why: either no gene names matched at all, or genes matched but none overlap any HERV loci (and it lists the matched genes).
Searching by location (loci mode only)
When the field is Locations, enter one region per line as
chromosome, start, end. A header row is optional. For example:
chromosome, start, end
chr12, 91000000, 96000000
chrY, 22000000, 25000000
Each row must have exactly three columns, chromosome must be
non-empty, and start/end must be integers. If a row is
malformed, the results page shows a clear validation message telling you which
row and what's wrong.
Flanking distance (bp)
When the field is Gene IDs, an extra Flanking distance (bp) box appears. Enter a non-negative whole number to widen the window around each gene when testing for overlap with loci. It defaults to 0 and is hidden/disabled for all other search types.
8.5 Reading the results
- Lineage searches return a list of cards, each showing the lineage, its internal ID, locus count, alternative names, and a snippet of its description. Click a card to open the lineage page.
- Loci searches return the full interactive loci table (the loci table section) — so you can immediately sort, filter, choose columns, and download the matching loci.
The results heading restates your query and the number of matches, so the search is easy to reproduce and cite.
9. Downloads and the data dictionary
9.1 Where downloads come from
You can export data from several places:
- Any loci table — via the Download options menu (TSV, BED, GTF, FASTA alignments, FASTA reference). Downloads honor your current filters.
- Lineage pages — reference locus and alignment files; plus a feature-table download on the Genes and Features table.
- Locus pages — the locus alignment file.
- Interactive tree — Export SVG for figures.
9.2 The Data Dictionary
Reachable from Browse All Loci → Data Dictionary (and linked above every loci table), the Data Dictionary documents every field that appears in the loci tables. For each field it lists a definition, data type, allowed values / format, and an example. It also states that coordinates use the hg19 assembly unless otherwise noted. This is the authoritative reference for interpreting any column you encounter.
10. Glossary of key terms
- ERV (endogenous retrovirus)
- A retrovirus-derived sequence that became a permanent, inherited part of the host genome.
- Locus
- A specific, mapped location of an ERV-derived sequence in the human genome. Identified by a Missillac ID.
- Lineage
- A reconstructed ancestral viral lineage that a set of loci derive from. Identified by a Lineage ID.
- Clade / Group (genus) / Subgroup (subgenus)
- The nested levels of the ERV taxonomy, from broadest to most specific.
- Mosaic loci
- Loci that cannot be assigned cleanly to a single clade.
- Coverage
- A visual summary of how much of a locus is supported by sequence/feature evidence.
- Taxonomic resolution
- How precisely a locus could be placed in the taxonomy.
- hg19 (GRCh37)
- The human reference genome assembly used for coordinates throughout ERV Navigator.
- TPM / Z-score (log10 TPM)
- Units used in the expression visualizations. The heatmap colors cells by the Z-score of log10 TPM.
Need more?
- About page — authorship, collaborators, and funding.
- Data Dictionary — precise definitions of every loci-table field.